Vertical Column Widget
Charts are a powerful way to visualize your data and gain insights. The Vertical Column Widget lets you customize colors, apply Formula, choose whether series are stacked, and more.
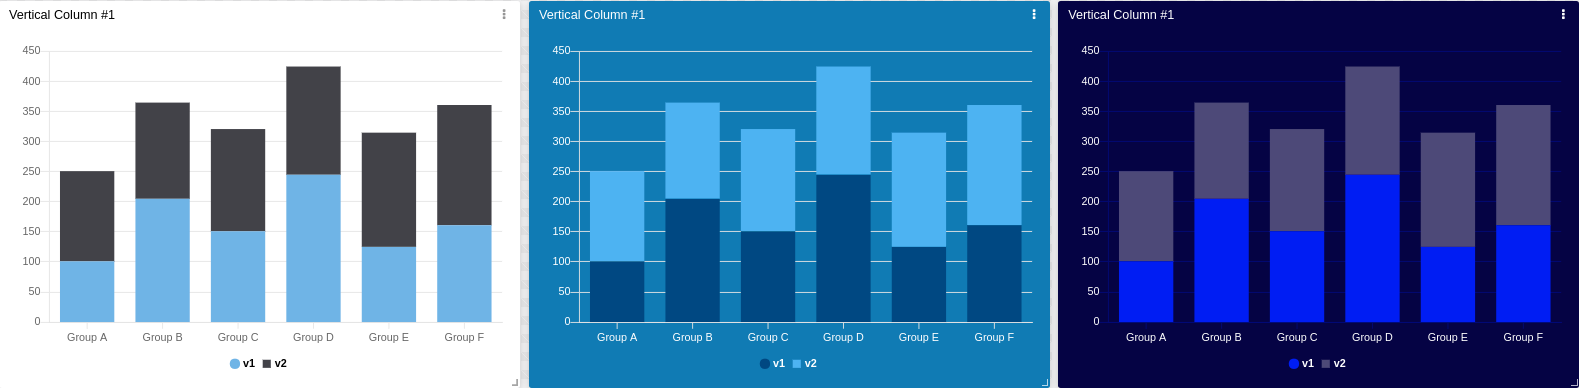
This widget also supports features such as metadata and series, which can be set in your variable data.
1. 'Data From' Field
This field allows you to set the device and variable that will be used by the widget.
Editing options for the selected variable
- Click on the cog icon to edit specific options such as formulas, color, and more.
- Click on the close icon to remove this variable from the widget’s data.
The available variables depend on the type of dashboard you are using; the difference is explained below.
1.1 Data From for Normal Dashboards
From the option 'Data From' in the right‑hand menu, select one device from your list and then choose the variable that contains the data.
1.2 Data From for Blueprint Dashboards
From the option 'Data From' in the right‑hand menu, add the Blueprint device and input the name of the variable that contains the information.
When using a Blueprint dashboard, the Variable field will not list variables to pick because it does not know which devices are linked to your Blueprint Device.
2. Composing X-axis and Y-axis
In the vertical column chart widget you can customize how data is displayed on both axes.
2.1 X‑axis
By default, the X‑axis shows the time of each value, and you can set a custom time range.
If you need to group data that does not share the same timestamp, select a variable that contains the grouping key; all values will then be grouped by series.
Data is ordered by time ascending by default, but it can also be sorted by series.
You can define the X‑axis time range dynamically using another variable. The payload should look like this:
{
  "variable": "time_range",
  "value": "Any value",
  "metadata": {
    "start_date": "2021-06-17T00:00:00.000Z",
    "end_date":   "2021-06-18T00:00:00.000Z"
  }
}
The start_date specifies the start of the range, and the end_date specifies the end. Both dates must be in ISO 8601 format.
2.2 Y‑axis
You can customize the scaling behavior on the vertical axis, apply metric prefixes or abbreviations, change the step value (the difference between each tick), and more.
The Y‑axis will automatically find the best scale for your data; manual adjustments are only needed if you have specific requirements.
3. Filtering data
You can pre‑set date filters to be displayed on the chart. Filters can be set in minutes, hours, days, weeks, months, or custom by choosing a date from the calendar.
4. Increasing performance
When a chart contains many data points, you can improve widget performance by enabling Downsampling. Downsampling makes the data easier to visualize and reduces load times.
Two parameters control downsampling:
- Threshold – limits the amount of data before downsampling starts.
- Factor – determines how many samples will be removed.
A higher factor increases performance but may reduce data recognizability, so choose a value that balances speed with clarity.