Semi Donut Widget
Using data from multiple variables, the Semi Donut widget automatically produces a semi-donut chart in which each slice represents a variable's data.
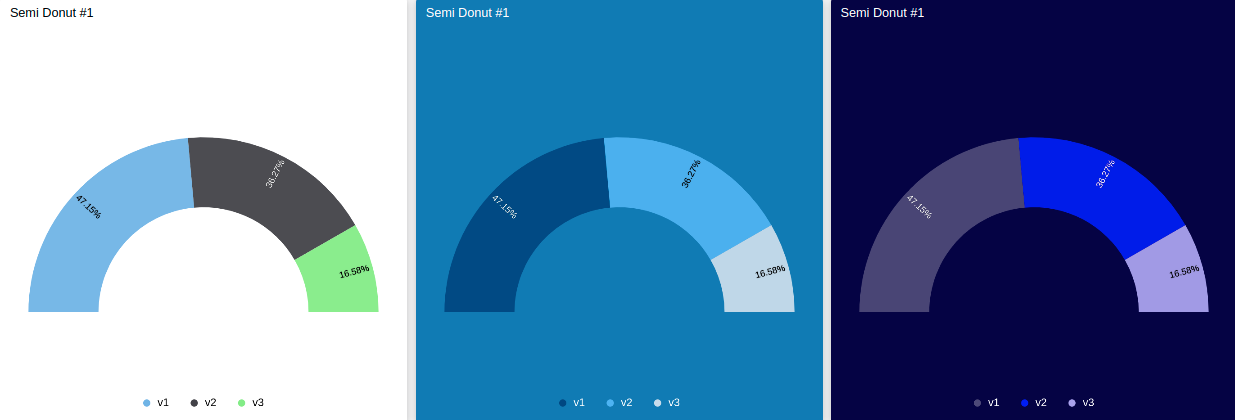
This widget also accepts features like metadata, which can be set in your variable data.
Creating your own
To add the widget to your dashboard, select the Semi Donut widget from the widget list and customize it to your preference. You can edit it using the options located on the right side of the widget editor.
1. 'Data From' Field
This field allows you to set the device and variable that will be used in this widget. It is dependent on the type of dashboard you are using; the difference is explained below.
Click on the cog icon to edit specific options for this variable, such as formulas, color, and more. Click on the close icon to remove this variable from the widget's data.
1.1 'Data From' for Normal Dashboards
From the option Data From on the right menu, select one device from your list of devices and the variable that contains the data.
1.2 'Data From' for Blueprint Dashboards
From the option Data From on the right menu, add the Blueprint device and input the name of the variable that contains the information.
When using a Blueprint dashboard, the field Variable will not list variables to be picked because it doesn't know the devices linked to your Blueprint Device.