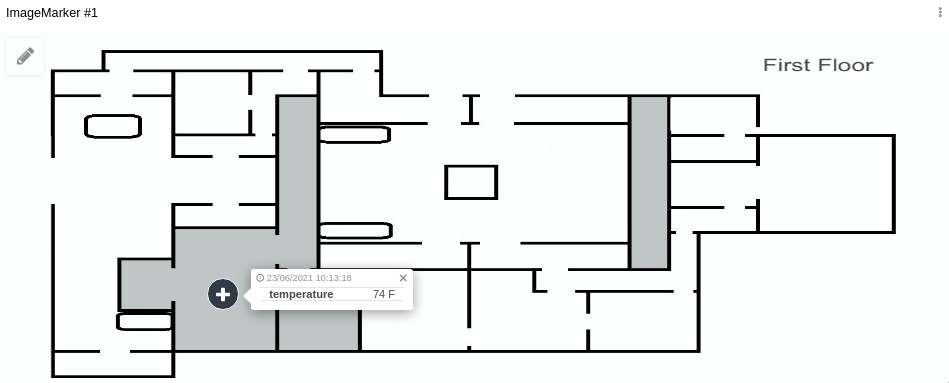
Image Marker Widget
The image marker widget allows you to place pins on images and customize each pin's color, value, and icon. Use it to annotate floor plans, maps, and other visuals with live or historical data.
This widget also accepts features like metadata and groups, which can be set in your variable data to alter how the widget behaves.
Creating your own
To add the widget to your dashboard, choose the Image Marker widget from the widget list and customize it to your preference. You can edit it by configuring the options located on the right side of the widget.
1. 'Data From' Field
This field allows you to set the device and variable that will be used in this widget.
The widget requires at least two variables: one for the pin’s data (e.g., temperature, status) and another to store all pin positions on the image.
- Normal Dashboards – Select a device from your list of devices and choose the variable that contains the pin data.
- Blueprint Dashboards – Add the Blueprint device and input the name of the variable that holds the information. Because the dashboard does not yet know which devices are linked to the Blueprint, the variable selector may initially appear empty.
2. Image Marker Behavior Modes
The widget has two behavior types:
| Mode | Description |
|---|---|
| Basic | Each pin corresponds to a distinct device. If you add multiple variables from the same device, they will appear in the same pin’s infobox. The number of pins is limited by the number of devices added. |
| Advanced | A single variable can produce multiple pins. This mode is useful when coordinates are updated continuously via a Device or Analysis. Variables can contain groups; each group creates its own pin, allowing one device to display many pins. |
3. Positioning Pins
To position a pin you need to set an x and y coordinate for your variable data. These numbers represent the relative position on the image: (0, 0) is the top‑left corner and (1, 1) is the bottom‑right corner.
3.1 Using Metadata
The selected variable must include x and y parameters inside its metadata:
{
  "fixed_position": {
    "66f16881c903480009ff1042465c78a000c39bee89461786": {
      "device": "66f16881c903480009ff1042",
      "label": "Temperature",
      "icon": "[https://svg.internal.tago.io/adjust.svg]",
      "img_pin": "google.com",
      "link_type": "image",
      "value": 71,
      "x": "0.4863223293768546",
      "y": "0.5155412946428571"
    }
  },
  "file": {
    "url": "[https://api.tago.io/file/635882e523251c00110779fa/buckets/66f16881c903480009ff1042/image.png]",
    "path": "/buckets/66f16881c903480009ff1042/image.png"
  }
}
Note: The metadata format differs between advanced and basic mode.
3.2 Using the Pin Position Editor
You can enable an editor so users can place pin positions, edit infobox content, and more directly on the image. This is especially useful for quick adjustments without editing variable data.
4. Layer
Each layer represents a background image; you can add multiple layers, each maintaining its own set of pins. Layers can be created or edited from the top of the editor screen. The pencil icon allows you to edit layer information such as name and uploaded image. Dragging an image onto the editor replaces the current layer image.
5. Editor
The editor lets users modify layers, pins, and geofences if editing permissions are enabled. It appears as a pencil icon on the top‑left of the widget. Changes are saved by clicking the save button; otherwise they are discarded. The editor includes a toolbox with four main tools:
- Default tool – Zoom and move the image.
- Add tool – Click on the image to add a pin (number of pins limited by data passed).
- Edit tool – Click an existing pin to edit its source, label, icon, etc.
- Delete tool – Remove a pin.
6. Infobox
An infobox automatically associates with each pin and can be customized with images, external links, formulas, embedded widgets, and more. It provides contextual information when a user clicks on a pin.
7. Filters
Filters allow users to narrow displayed pins by device, variable, or value. A table lists all currently visible pins, making it easier to analyze data subsets.
8. Geofence
Geofences let you draw colored geographic boundaries on the image to visualize device trajectories within a zone. When enabled, the geofence can be edited via the tab in the upper right corner of the editor. Tools available include:
- Draw polygon – Click points to form a shape; finish by clicking the first point.
- Draw circle – Click center then another point for radius.
- Edit tool – Modify existing polygons or circles.
- Delete tool – Remove geofences.