Heat Map Widget
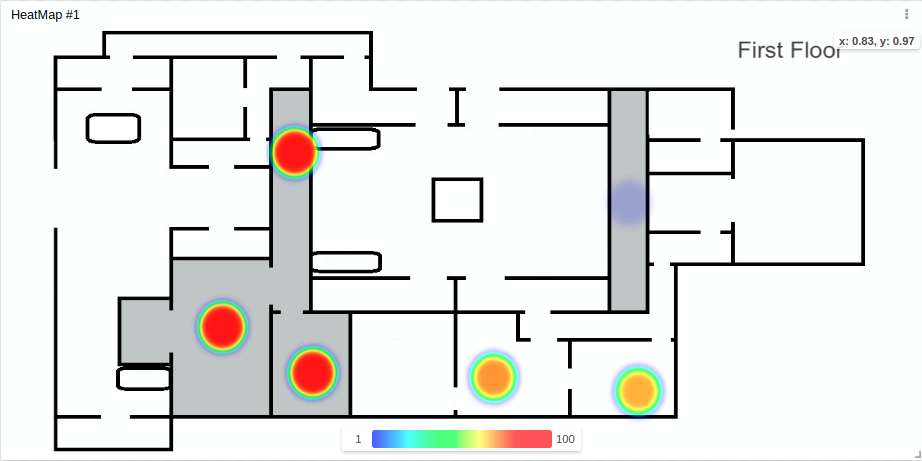
With the Heat Map widget you can create a colorful layer of bubbles over an image to represent the intensity of variables. Higher variable values produce redder (larger/intense) bubbles, and you can add a heat scale to the layer to show the value range.
This widget also accepts features like metadata, which can be set in your variable data.
Creating your own
To add the Heat Map widget to your dashboard, choose "Heat map" from the widget list and customize it to your preference. Edit the widget using the options located on the right side of the widget editor.
Widget compatibility
This widget works for both Normal dashboards and Blueprint dashboards.
Data From field
The Data From field lets you select the device and variable that will feed data into this widget.
- In a Normal dashboard, choose one of your devices from the list and then pick the variable that contains the data.
- In a Blueprint dashboard, add the Blueprint device and input the name of the variable that holds the information.
When using a Blueprint dashboard, the variable selector will not list variables because it does not know which devices are linked to your Blueprint Device.
Setting a background image
The widget supports three types of background images:
- Static – an image from a fixed URL.
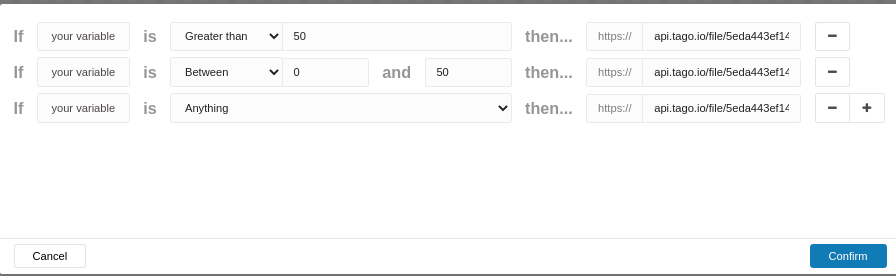
- Conditional – multiple conditions each with its own image URL; the image that matches the condition is displayed.
- Dynamic – the image URL comes from variable data.
You can store images in TagoIO’s file system and use a public URL.
Bubble position
You must provide an X and Y coordinate for each variable. The coordinates are normalized between 0 and 1, where (0, 0) is the top‑left corner of the image and (1, 1) is the bottom‑right corner.
Using metadata
If your variable’s metadata contains x and y, those values will be used as the bubble position:
{
  "variable": "heat",
  "value": 71,
  "metadata": {"x":0.2, "y":0.3}
}
The widget will display a heat bubble at that location.
Using the widget editor
You can also set coordinates directly in the widget editor. If metadata is not present, the editor values are used.
Range of scale
You can define a custom range for the heat bar that appears at the bottom of the image. By default, the scale is generated automatically from your variable values.
The scale determines which color corresponds to each value; even if you hide the heat bar, bubbles will still respect this mapping.
The range can be set with fixed or dynamic values using another variable’s data, similar to Gauge's range.