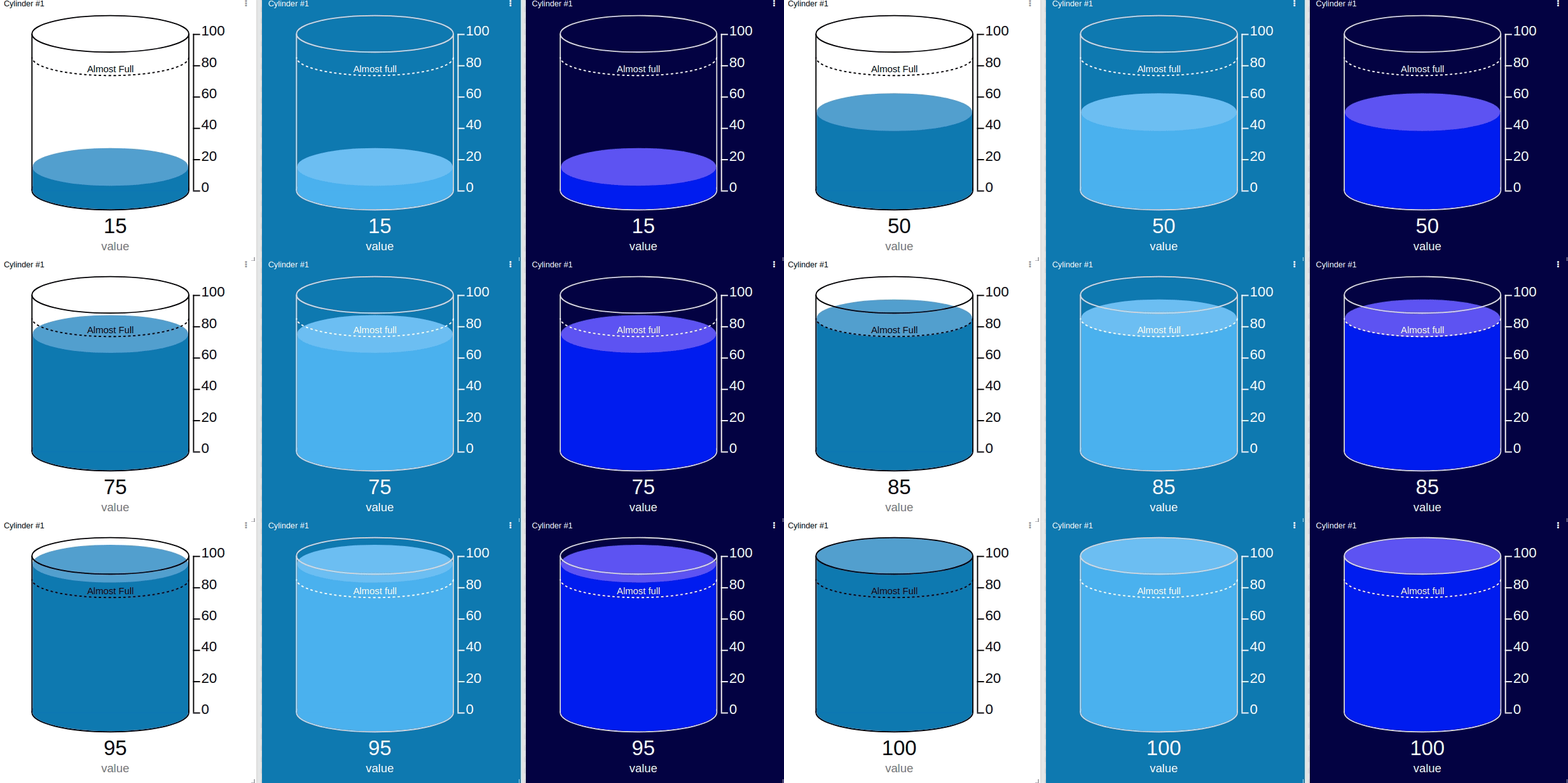
Cylinder Widget
Cylinders are simple and useful widgets that visualize values relative to a defined range (with maximum and minimum limits) using a cylinder gauge.

This widget also accepts features like metadata that can be set in your variable data. (Refer to the Metadata documentation for details.)
Creating your own
To add the Cylinder widget to your dashboard, choose the Cylinder widget from the widget list and customize it to your preference. You can edit the widget using the options located on the right side of the widget.
Data source configuration
The Data From field allows you to select the device and variable that will feed data into this widget.
- For normal dashboards, choose a device from your list and then pick the variable that contains the data.
- For Blueprint dashboards, add the Blueprint device and enter the name of the variable manually; the variable selector may not list variables because the dashboard does not know which devices are linked to the Blueprint.
This widget works for both Normal and Blueprint dashboards.
Level labels
Level labels appear as dashed lines inside the cylinder and can represent limits or divisions. They can be set dynamically by variable data, allowing you to highlight thresholds directly on the gauge.