Live Inspector
The live inspector is a tool for developers to debug parser scripts and monitor traffic to and from devices.
To access the live inspector, go to the Device, select the device, and click the Live Inspector tab.
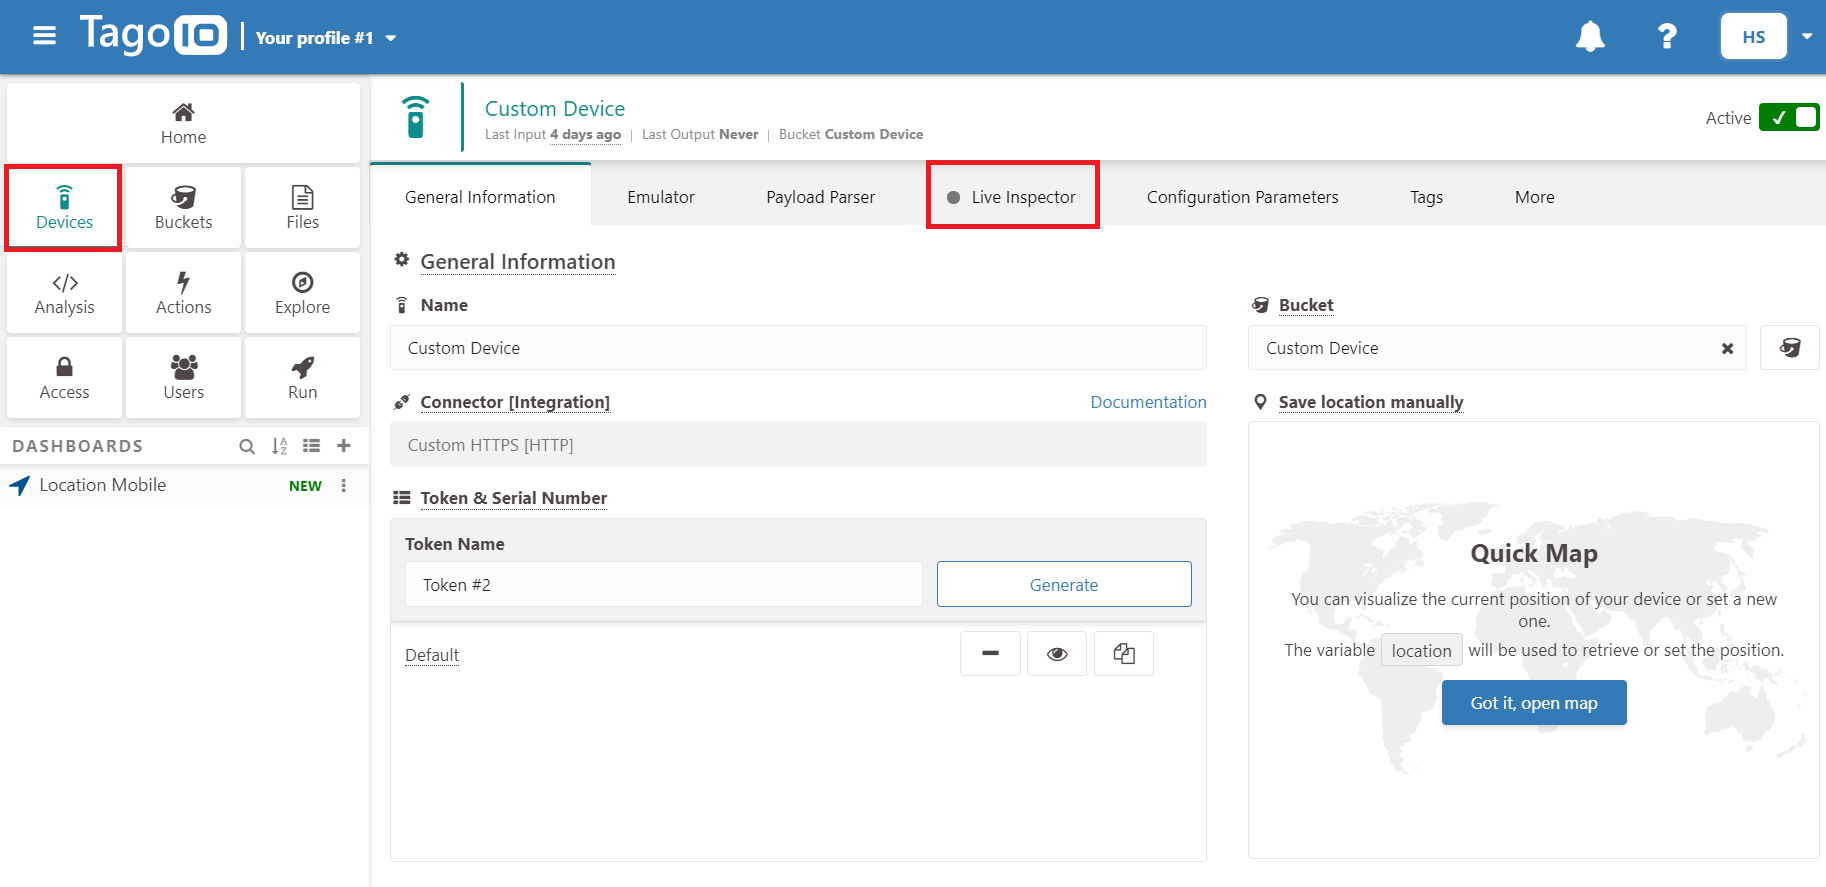
Start the live inspector by clicking the green arrow on the right of the Live Inspector panel.
Live Inspector overview
- With Live Inspector, you can view all active connections for the selected device with TagoIO.
- The inspector is only visible while you are visiting the device's Live Inspector page.
- Typical UI elements in the Live Inspector:
- A search field to filter incoming messages.
- Page-size controls (e.g., 25, 50, 100, 500) to adjust how many items are shown per page.
- A green start/stop arrow to begin or pause live monitoring.
- Log/list area showing incoming device traffic and connection details.
- All traffic to and from the device is monitored in real time; each package sent is recorded and displayed in the Live Inspector.
- The inspector stops automatically when you leave the page or close the browser; it does not run in the background after the window has been closed.